
Traffic increased but revenue declined: what to check
A step-by-step diagnostic for separating acquisition growth, conversion deterioration, revenue timing, customer mix, refunds, and attribution limits.

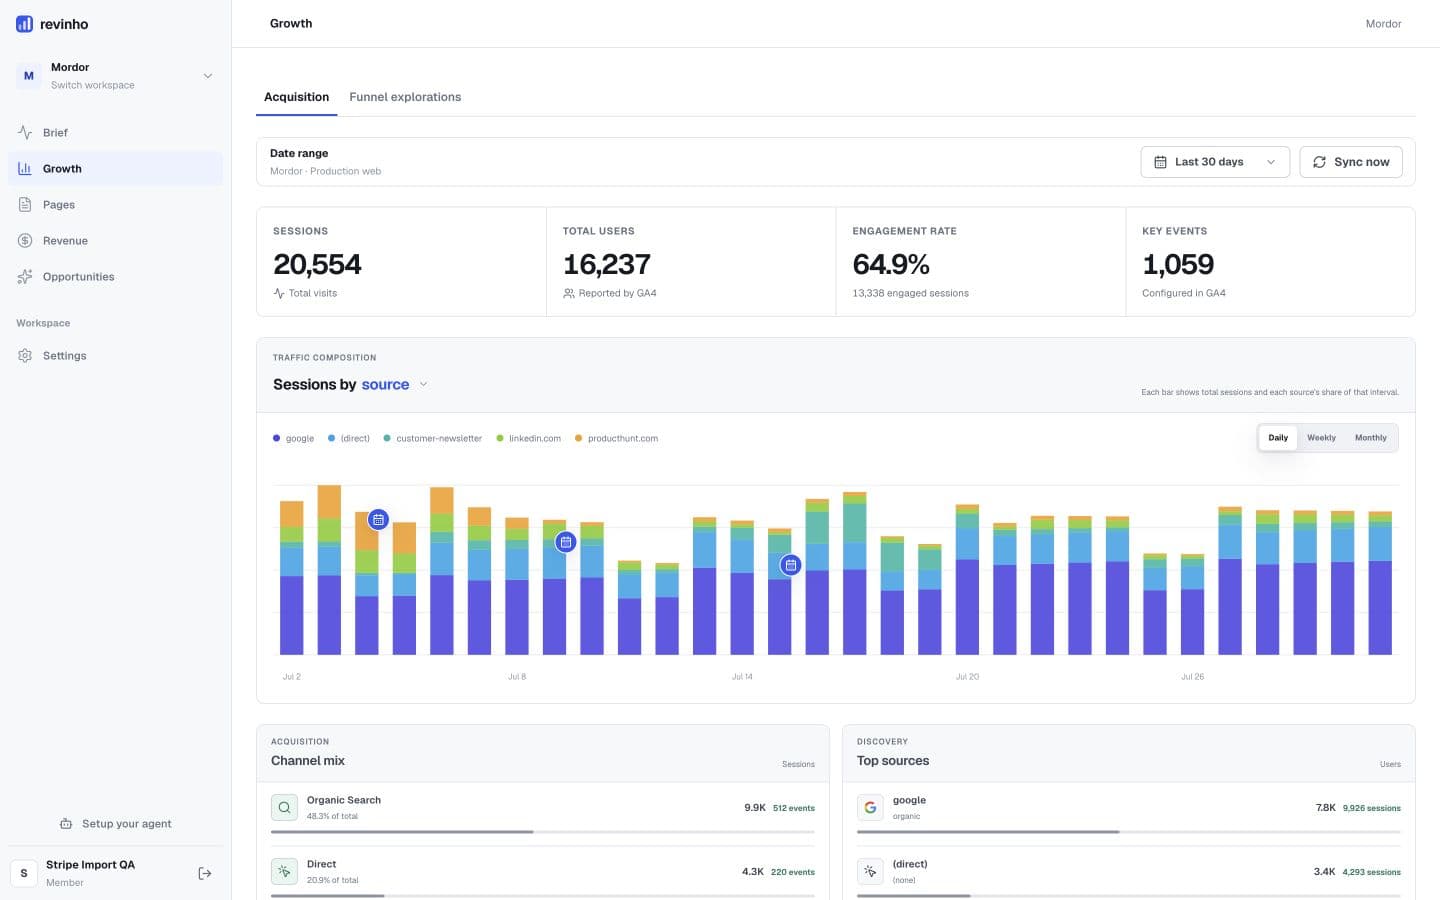
Updated: added a representative Revinho Growth capture showing aggregate acquisition evidence without customer or revenue detail.
Traffic can rise while revenue falls for entirely ordinary reasons. The new visits may have lower commercial intent. Conversion may have weakened. Existing customers may have churned. A refund or billing date may have moved money into another period.
The right response is not to pick one story from the chart. It is to narrow the possibilities in a fixed order.
Verify the change before explaining it
Start with four checks:
- Are the current and previous periods the same length?
- Are both periods complete in the workspace timezone?
- Is revenue net of refunds in both periods?
- Are all supported currencies represented consistently?
Then keep the absolute values next to the percentages.
Sessions:    10,000 -> 12,500  (+25%)
Key events:     500 ->    475   (-5%)
Net revenue: €20,000 -> €17,000 (-15%)
This is not simply “traffic up, revenue down.” It also contains a conversion signal: the visitor-to-key-event rate fell from 5.0% to 3.8%.
Find where the extra traffic came from
Do not diagnose the site total first. Break the 2,500 additional sessions down by:
- default channel group;
- source and medium;
- campaign;
- landing page;
- country and device when the difference is large enough to interpret.
The explanation often becomes visible immediately. A high-intent referral may be flat while an informational organic page gains 3,000 sessions. The site grew, but the commercial audience did not.
For each growing segment, compare sessions, engaged sessions, and key events. A source with rapid traffic growth and no key-event movement deserves a different investigation from a source whose conversion rate stayed stable.
Check whether conversion deteriorated
Use a rate that the workspace actually measures:
visitor-to-key-event rate = key events / sessions
Compare the rate for the whole site and the segments that created the traffic increase. Then inspect the saved GA4 funnel that is closest to the real journey.
If the first three funnel steps remain stable but the purchase step falls, investigate checkout, pricing, payment methods, and purchase-event configuration. If the largest exit occurs between the landing page and the first meaningful action, investigate intent alignment and the page's next step.
GA4 funnel evidence describes the events already configured in the property. It does not prove why a visitor abandoned.
Check landing pages, not just channels
A channel can look healthy while one landing page absorbs most of its growth.
Classify the growing pages:
- High traffic, low conversion: traffic increased but key-event rate is below the workspace baseline.
- Hidden winner: lower traffic but unusually strong key-event behavior.
- Fast-growing page: current sessions materially exceed the previous period.
- Organic decay: search visibility or clicks fell on a historically useful page.
Then ask whether the page's search or campaign intent matches the action you expect. A guide answering an early research question should not be judged by the same immediate purchase rate as a pricing page.
Check Stripe outcomes separately
Once the behavior path is understood, inspect the commercial side:
- Gross revenue: did successful collected money fall?
- Refunds: did returns erase otherwise stable sales?
- New customers: were there fewer first commercial outcomes?
- Current MRR: did recurring commitments contract?
- New and churned MRR: did growth continue while older subscriptions ended?
- Product and plan mix: did customers choose lower-priced or one-off products?
- Payment dates: did annual renewals or large invoices move across the period boundary?
Revenue can fall with stable new-customer count when the average purchase is lower. MRR can fall while gross revenue rises when one-off payments replace recurring commitments. Keep those measures separate.
Check operational context without turning it into proof
Annotations are useful for launches, incidents, pricing changes, campaigns, and content updates. They help a team remember what changed around a date.
An annotation on the same day as a conversion drop is a lead, not a causal conclusion. Verify it with more specific evidence: affected devices, pages, checkout errors, payment failures, or event changes.
Say:
The visitor-to-key-event rate fell after the July 12 release, and the decline was concentrated on mobile.
Do not say:
The July 12 release caused revenue to fall.
The second statement requires evidence that rules out other explanations.
A diagnostic decision path
Use this order:
- Validate the comparison. Equal windows, complete data, one timezone, stable definitions.
- Locate the traffic growth. Channel, source, campaign, landing page, device, and country.
- Measure behavior. Key-event rate and funnel completion for the growing segments.
- Inspect page intent. Does the landing page promise and next step fit the visitor?
- Inspect Stripe outcomes. Gross revenue, refunds, MRR, customers, and plan mix.
- Review context. Releases, outages, pricing changes, or campaigns as hypotheses.
- Choose one test. Fix the narrowest high-confidence problem before redesigning the whole funnel.
What Revinho can say responsibly
Revinho can deterministically state that traffic increased, conversion deteriorated, or Stripe revenue declined across equivalent periods. It can show which sources and pages account for the traffic movement and store the evidence behind an opportunity.
Without a deterministic user-level join, it cannot say the new traffic caused the revenue decline. The correct conclusion is narrower and more useful:
Sessions increased 25%, while net revenue decreased 15% during the same period. The additional sessions were concentrated on three organic landing pages, and the visitor-to-key-event rate fell from 5.0% to 3.8%.
That statement tells the team where to investigate without inventing certainty.